Is the livestock sector responsible for climate change? Quantifying the impact.
Despite the reported contributions of livestock production to climate change, the true impacts of it are difficult to measure. The main reason being that the livestock sector also positively contributes to ecosystem services, as well as the livelihoods and food security of many.
Assessing the impact of total animal biomass
A brief history
The rearing and keeping of livestock probably contributed to environmental change from the start (9th century BCE), and increasing populations of ruminant livestock between 5000 and 2000 BCE are thought to be one cause of increasing global atmospheric methane concentrations over those millennia.
The new way
With the development of technology and its application to the agricultural sector, traditional pastoral farming has been replaced by large-scale industrial livestock husbandry approaches in many regions.
With technology, farmers can increase productivity, as well as the level of control they have over breeding and animal growth. Feed optimisation and the ability to purchase specific products to increase growth and performance are examples of this.
Despite the fact that greenhouse gas emissions (GHGs) per animal are higher, GHGs per unit of animal product have declined dramatically.
Rapid growth
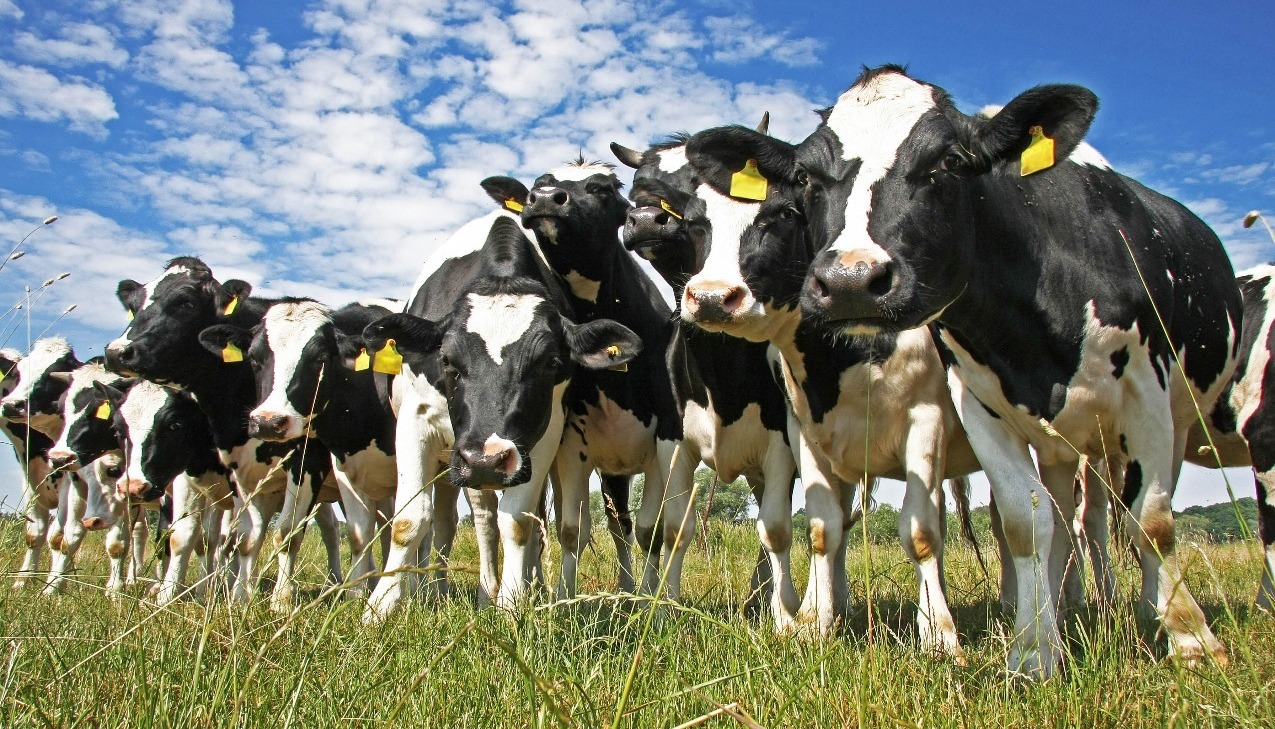
The global biomass of mammalian livestock is now 67% greater than that of humans and 757% greater than that of all wild animals. Respectively, the global biomass of domesticated poultry is 150% greater than that of all wild birds. (Bar-On et al., 2018).
It has been suggested that areas of land used for pasture and/or grazing purposes rose drastically, from 1.4 million square kilometres to 3.7 million square kilometres between 800 and 1700 CE (Pongratz et al., 2008). The use of land for pasture/grazing has continued to rise, to 22-30% of the 130 million square kilometres of ice-free land globally currently used to accommodate livestock (Alkemade et al., 2013).
Extensive cattle grazing
Livestock production is increasingly technical and productive in the wealthier countries; however, it remains extensive in the poorer countries. Typically, livestock reared in low-input regions have a lower body mass than those reared elsewhere. Despite this, the total livestock intake from grazing in low-input regions is greater than that of wealthier countries.
Australia and the US are examples of wealthy nations that still practice extensive cattle grazing. In the US, most cattle grazing occurs in the Western states where moisture is a rarity.
With the most productive land allocated to the growing and cultivation of major crops (wheat, corn, sorghum, etc), grazing and pasture is forced to occur on arid lands, such as shrublands, deserts and savannahs.
Arid lands produce feed options of lower digestibility, which in turn leads to higher methane emissions, slower livestock growth rates and a decrease in feed-use efficiency.
Quantifying the impact: developing mitigation strategies
The challenge ahead for the sector is not only in identifying the extent of this impact, but also to better understand it so that the sector can develop mitigation strategies to avoid further environmental damage.
A complicated relationship: Methane and livestock
Methane is regarded as the second most important greenhouse gas, however, is responsible for greater levels of global warming than any other gas, excluding carbon dioxide.
Both domesticated and wild ruminants have specialised guts where methanogenic bacteria live and break down feed through fermentation. Enteric fermentation allows ruminants to obtain nutrients from otherwise indigestible fibrous feed. Despite the clear positives of enteric fermentation, the process also results in the emission of methane. (Figure 1).

Figure 1: US methane emissions by source (Environmental Protection Agency, 2020) Available at: https://www.epa.gov/ghgemissions/overview-greenhouse-gases
Quantifying livestock methane emissions
As mentioned previously, it’s extremely difficult to quantify methane emissions from a diverse subject pool of differing livestock herds. It is, however, not impossible.
Dependent on the source, the release of methane emissions into the atmosphere can be measured using the following:
Bottom-up measurements – The process of making measurements of methane quantities over a selected time period from individual animals and manure management locations that represent variation.
Bottom-up inventory-based estimations – The process includes the requirements above but involves the development of models that detail the average amount of a particular gas emitted per animal per year.
Top-down studies – This process relies on the use of atmospheric measurements made at and/or near to the Earth’s surface. Using this data alongside an atmospheric transport model can assist in detecting the source of methane emissions.
Disaggregation and downscaling – This process utilises bottom-up measurements of emissions and attempts to better the resolution. This can be achieved through placing emissions on a map using a state and/or county’s livestock population and spatial boundaries as the source.
Global warming potential (GWP) as an indicator
Despite the focus on methane, nitrous oxide, ammonia and volatile organic compounds are also emitted by the livestock sector. For example, carbon dioxide is emitted via animal respiration, whilst its similarly emitted through the decomposition of organic manure.
Each gas is summarised using its global warming potential (GWP). The GWP measurement represents the amount of heat energy that one tonne of emitted gas will absorb over a selected period, relative to the amount of energy that one tonne of CO2 would absorb. The GWP of a gas instigates a conversion of potential gas emitted into carbon dioxide equivalents. (CO2eq).
Recent research suggests that the use of GWP may underestimate the level of global warming caused by non-CO2 greenhouse gases because GWPs were developed without considering:
- The cooling effect of aerosols in the last 100 years
- The diverse atmospheric dynamics of other greenhouse gases
With this in mind, it’s a challenge to use GWPs as a means of accurate reflection of the contributions of the livestock sector to climate change.
Leaving a mark
Carbon footprint (CF) analysis is the process by which the emission of multiple greenhouse gases from a single source is quantified and later analysed.
Popular CF studies focus on the analysis of nitrous oxide emissions from fertiliser and the multi-purpose use of fossil fuels (transportation, growing, refrigeration, etc) in agriculture.
Case study
From 1999-2006, yearly increases in atmospheric methane concentrations leveled out. However, from 2006 onwards, methane concentrations began to rise again and have continued to increase each year.
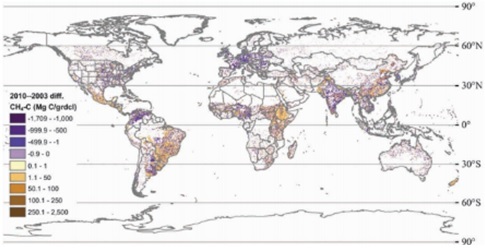
Figure 2: Change in total livestock methane emissions between 2003 and 2010 (2010 [minus] 2003 emissions [in Mg C]), per 0.05 × 0.05° gridcell (Wolf et al., 2017). Distributed under Creative Commons Attribution 4.0 International License (http://creativecommons. org/licenses/by/4.0/).
The changes in methane emissions from the livestock sector over this time period (Figure 2), do implicate livestock – amongst several other methane source sectors – as a potential cause for this continual increase (Wolf et al. 2017). However, this is not an accepted conclusion yet. For example, Hristov et al. (2018) suggested that in the period from 1999-2006 where global methane concentrations remained at a constant, the global cattle population in fact increased and thus the sudden increase of methane concentrations after 2006, could not be attributed to cattle.
Whilst at a glance global cattle population did experience an increase, there are several changes that the livestock sector has had to adjust to.
- In the US, cattle numbers have remained steady but body mass increased
- In South America, cattle populations increased
- The introduction of by-product feeds into livestock diets increased in the US and other countries, potentially reducing methane emissions
- Methane emissions associated with manure management increased with increasing usage of anaerobic lagoons
With these multiple changes in livestock and their management, as well as changes in other methane source sectors as well as atmospheric sinks, a definitive explanation for the resumed increases in atmospheric methane concentrations since 2006 is still elusive.
Conclusions
It is extremely difficult to measure the livestock sector’s impact on climate change.
What we do know is that methane emissions have increased over the last decade, but the intensity of the emissions has decreased. This decrease has been credited to the modernising of livestock systems which function on increasing animal and feed productivity.
Despite an increase in productivity however, these livestock systems still contribute to climate change. It’s even been suggested that the reliance on using the global warming potential (GWP) of emitted gases is doing more harm than good as we can underestimate the true impacts of these gases on the environment.
The future
The use of life cycle assessments (LCAs) and carbon footprint (CF) analysis, amongst other approaches are evolving each time they are implemented. The evolution of these methods translates to more accurate accounts of GHGs emitted. From this, we can determine whether this emission is offset by the ultimate production of food and its economic return.
Although there still remains a cloud of uncertainty over the true extent of agriculture’s impact, the sector must continue to work sustainably with the end goal of minimising GHG emissions.
‘Quantifying the role of livestock in climate change’ features in the new title ‘Climate change and agriculture’. Delphine Deryng (ed), 2020, Burleigh Dodds Science Publishing, Cambridge, UK (ISBN: 978-1-78676-320-4; https://bdspublishing.com)
About the blog
This blog has been written by Katherine Lister - Marketing Executive at Burleigh Dodds Science Publishing. The blog's content has been derived from Quantifying the role of livestock in climate change, a chapter taken from Climate change and agriculture.
About the chapter author
Dr Julie Wolf is a researcher at the USDA-ARS, USA.
New Sustainability titles
